

My school year starts with speech/language and hearing screenings of preschool – 1st grade students. Following that are meetings with teachers and recommendations for evaluations if needed.
The parents I come into contact with are nearly always anxious when they see “recommend a full evaluation” checked on the screening summary sheet. They’re keen to have testing completed asap and, in our conference, want detailed explanations about the questions I asked and what scores were achieved.
It’s a delicate balance.
If a parent is observing an evaluation, I always set expectations up ahead of time. For an articulation test, I’ll tell them that we will complete every item. For language testing, I need to make it clear that I will continue the test until their child is unable to perform the tasks (I might mention the particular ceiling here—ie. until they miss five in a row). I reiterate that the plan is to have their child miss questions and that this is unlike a classroom test in which you have a set number of questions to complete.
I’ll give an overall description of the test and subtests with a (made up) example when needed. I never give actual missed items because we’ll end up in a rabbit hole of why their child answered the way they did and how it wasn’t actually incorrect for them.
Then it’s time for a brief statistics lesson.
Raw score: I don’t typically include this information, but it’s helpful if a parent understands that the raw score is simply the number of questions the student answered correctly on the test or subtest.
Age equivalencies: This is the first number that sets parents hearts racing and I’m always quick to explain that they aren’t the best representation of performance. (It is a measure I need to include in reports if available however.) Age equivalents reflect the average age at which a raw score is achieved which means you can expect half of children that age will score below this, and half above. It does not take into account the range of normal performance.
What I tell parents is that age equivalencies don’t reflect consistency of performance and simply show that initial raw score in a different light. A young child might get to the 20th question before the test ends and receive a raw score of 17, while an older student might get to the 35th question and still have a raw score of 17. Both would have the same age equivalency score, but the child that had the opportunity to answer more questions is demonstrating to me more advanced skills (though there are obviously holes or inconsistencies in their performance).
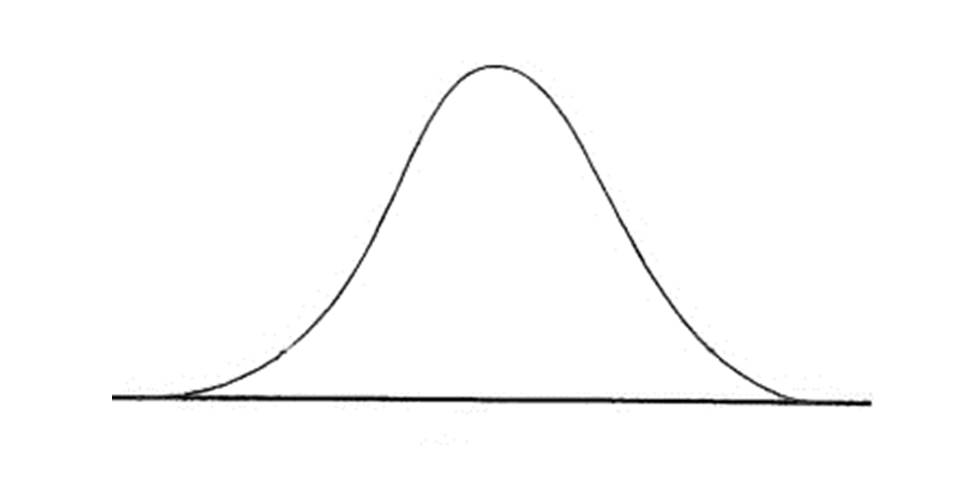
Standard Scores: I pull out paper and draw the bell curve. I put the mean at the highest point (usually 100) and make sure they understand that this gives us a range of normal for comparison with the mean as the average score (and not perfect performance). Next, I’ll show them where their child falls and how many standard deviations it is from the mean. (If needed, I would show at what point their child qualifies for services.)
I may also mention that standard scores will be one of the ways we measure progress over time.
For students receiving an entire educational evaluation, I’ll show how standard scores can be used as a point of comparison to judge relative strengths and weaknesses.
Percentile ranks: This is another stat that tends to concern parents and again, I use the bell curve to show that the percentile rank matches up with the standard scores. Many parents see a percentile rank of 47 and panic, thinking this means their child got 47% of the questions correct and a “failing” grade! It’s important we clarify that a percentile rank is not a percentage grade.
While math, statistics especially, can seem scary (perhaps especially to the therapist providing the lesson) and as software/apps begin generating more and more of our numbers even the SLP becomes further removed from the calculations. Yet, it’s critical that our parents receive all the information we collect and explanations of what the numbers represent. The beauty of statistics is that understanding, when using a quick picture and numbers, is within the grasp of most parents regardless of their own language or educational limitations.
For a parent handout that you can include with your reports, click here.
Tell the truth, math–love it or dread it?


This Post Has 3 Comments
Do you have to include age equivalencies in your report for insurance purposes?
I don’t submit directly to insurance companies so I don’t know what their typical requirements would be. It seems to be a traditional and now expected stat on reports to the parent and school that I’m at. Kim
gREAT INFO. wILL UTILIZED THIS IN MY PREACTICE
Comments are closed.